Data Science Team & Tech Lead

Tag: MLOps

  • Onto Kubernetes – Part 4

    Onto Kubernetes – Part 4

    With the Prometheus-Loki-Grafana stack being deployed, the observability stack has been fully deployed on the Kubernetes cluster. Operational metrics gathered by Prometheus and logs aggregated by Loki are finally fed into the Grafana for easier visualisation.

    I have spoken about Prometheus (https://prometheus.io/) in my last post so I will not repeat it.

    In terms of Loki (https://grafana.com/oss/loki/), it is easier to set up than I originally thought, given the number of components that make up Loki (12 components in total). Roughly about half of these components are core components that are needed for Loki to function (e.g. distributor, ingester), but the other half are optional supporting components that can be turned off safely (e.g. query scheduler, table manager).

    Most of the heavy lifting is done by Promtail, as it automatically discovers target logs to be scraped and pushes them to Loki. In contrast, a separate exporter needs to be setup per pod/service to make metrics visible to Prometheus, which involves a lot more efforts. That being said, Promtail has now been deprecated (https://grafana.com/docs/loki/latest/send-data/promtail/).

    As for Grafana (https://grafana.com/), it seems like a simple dashboard solution that is built mostly for observability purposes. But it impresses me in a few ways.

    Grafana is very efficient in terms of resource usage relative to its speeds of performance. The entire Grafana could run on less than 200Mb memory, while doing live refresh of data-heavy dashboard. Other dashboard solutions that I have worked with will not be able to cope with the same amount of data with same refresh speed without significant configuration effort (setup caching etc.).

    As I am working with Grafana operator (https://github.com/grafana/grafana-operator), it is very easy to configure data sources and dashboards in Grafana. I just have to define GrafanaDashboard and GrafanaDataSource CRDs, and Grafana will be able to pick them up automatically.

    The definition of Grafana dashboards in json format is interesting as well. It is easy to version control and could be modified in its raw text format. The only complain I have is that the public gallery of Grafana dashboards (https://grafana.com/grafana/dashboards/) is relatively limited in terms of selections. Based on my anecdotal experience, most dashboard submissions on there are outdated so not deployable out of the box.

    Besides observability for metrics and logs, another common observability implementation is to monitor internal network traffic using a service mesh like LinkerD (https://linkerd.io/). I will leave this for another day, purely due to a lack of time.

    The last piece of core supporting Kubernetes service that I will set up next will be the Kubernetes resources and volumes backup using Velero (https://velero.io/). While most of my Kubernetes deployments are stateless, I do run a few databases as well. Losing the data on them will be a disaster if there is no backup.
  • Onto Kubernetes – Part 3

    Onto Kubernetes – Part 3

    I am still working on the Kubernetes stack behind my personal website whenever I have some free time.

    The goal is still the same – to build my own personal Kubernetes-powered data science/machine learning production deployment stack (And yes, I know about Kubeflow/AWS Sagemaker/Databricks/etc).

    However my key objective now lies not with finding out whether using Kubernetes will save maintenance efforts (short answer – it does not save much maintenance efforts at a small scale), but with seeing how a best practice end state Kubernetes stack will look like and the effort needed to get there.

    So what have I been up to? Some of my time in this period has been spent on fixing minor issues that were not noticed during the initial deployments.

    Example 1, my WordPress pod is losing my custom theme every time the pod is restarted. Why is that? It is because the persistent volume seems to get overwritten each time by the Bitnami WordPress helm chart that I am using. The solution? I implemented a custom init container that repopulates the Wordress root directory by pulling a backup from S3.

    Example 2, a subset of my pods have been crashing regularly due to a node becoming unhealthy. Why is that? It is because my custom Airflow and Dash containers seem to have unknown memory leaks, leading to resource starvation on the node causing pods to be evicted. The solution? I manually set up custom resource requests and limits for all Kubernetes containers after monitoring their typical utilisations. (I have been putting off doing this for a while thinking I could get by fine, but this incident has proven that I am wrong.)

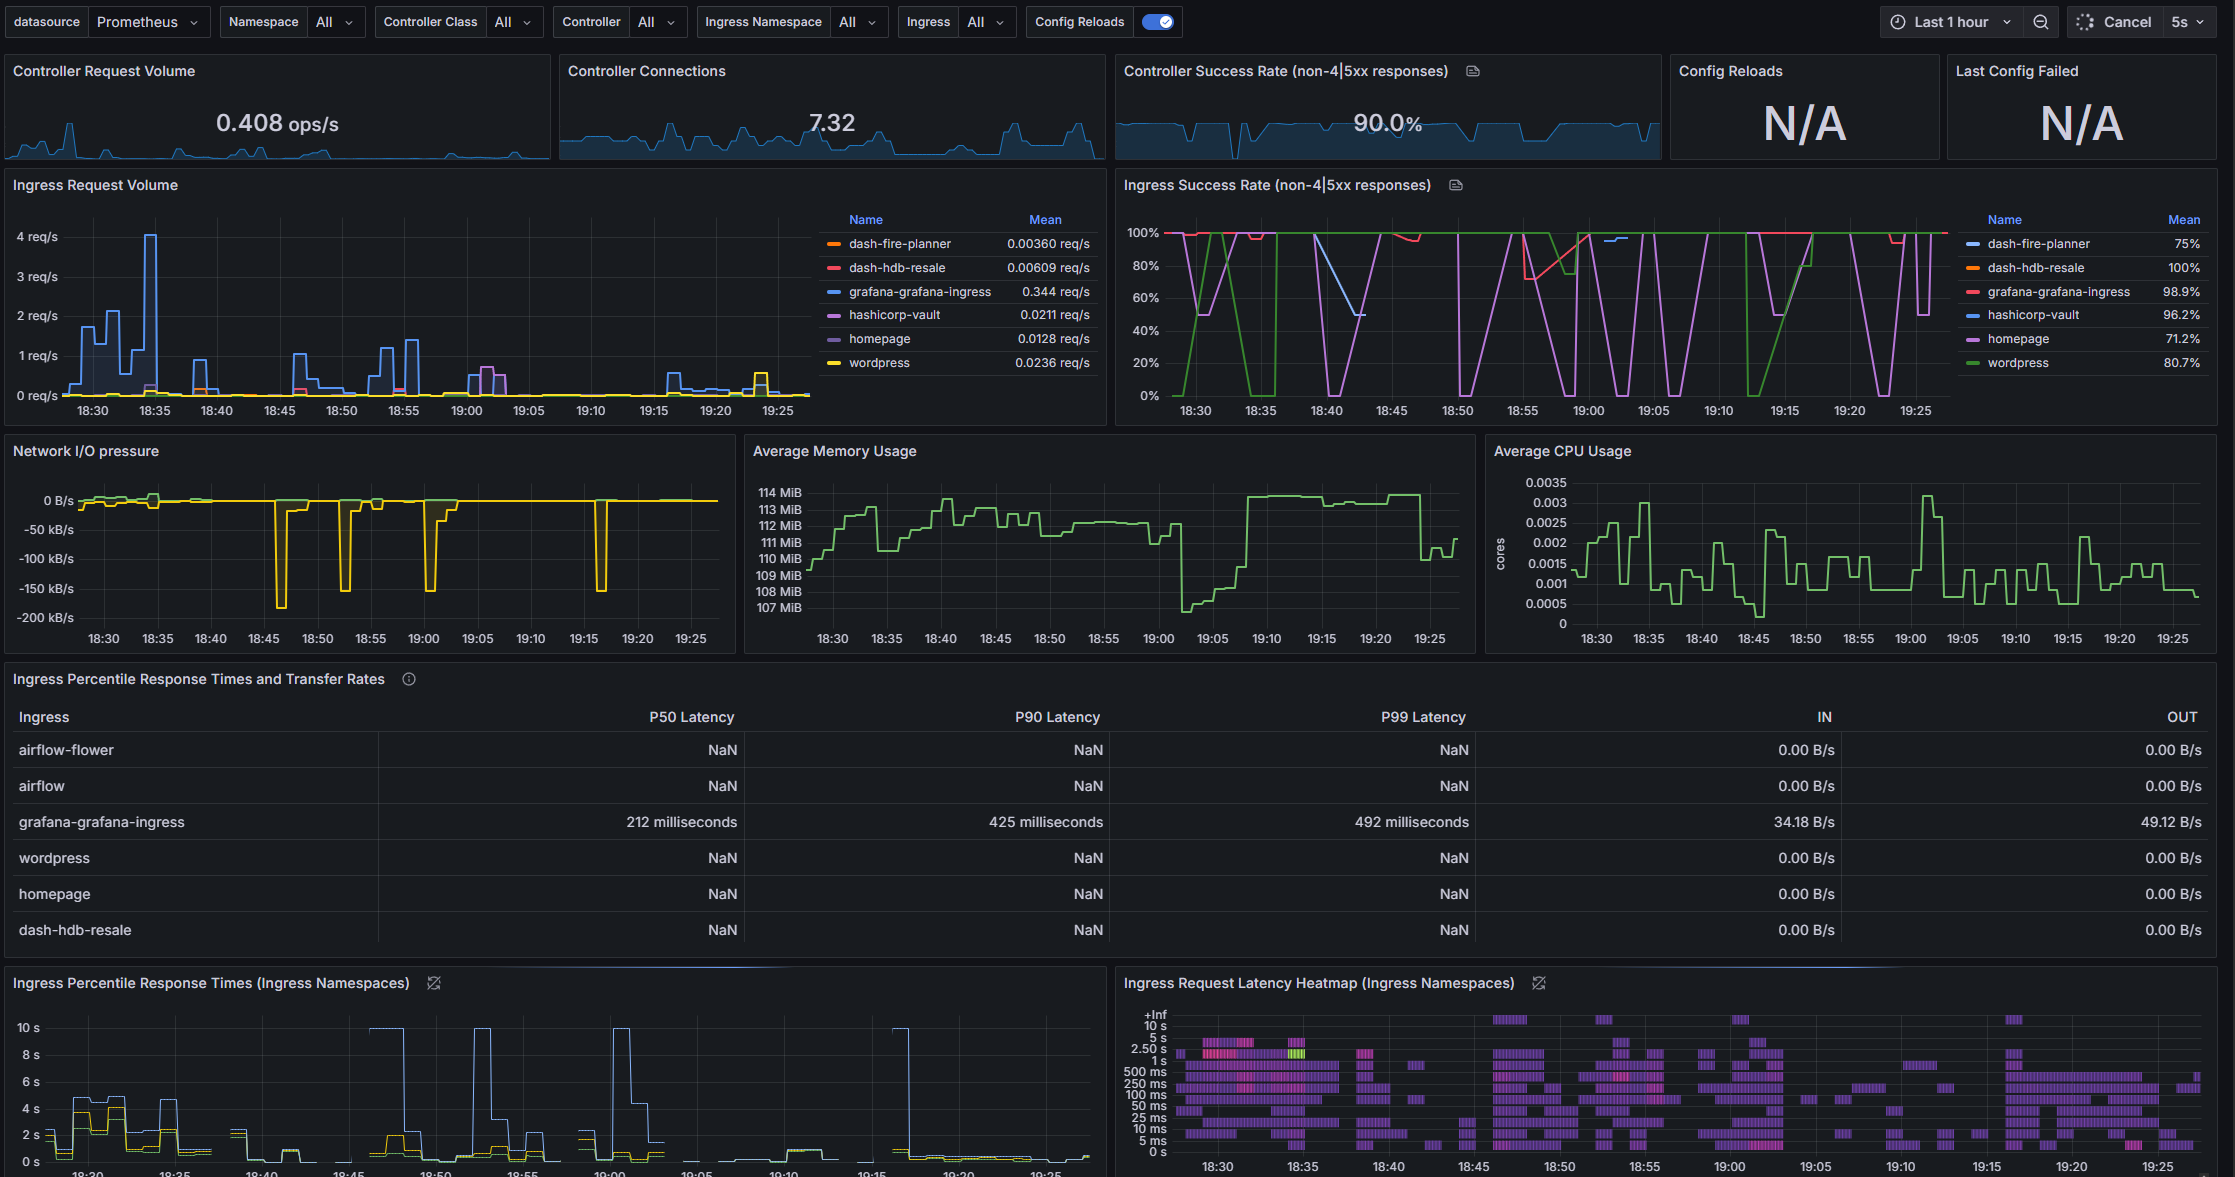
    The majority of my time has been spent on setting up proper (1) secret management (using Hashicorp Vault + External Secrets Operator) and (2) monitoring (using Prometheus + Grafana) stacks.

    On secret management. Hashicorp Vault + External Secrets Operator have been relatively easy to use, with well-constructed and documented helm charts.

    The concept behind Hashicorp Vault is relatively easy to understand (i.e. think of it like a password manager). The key trap for any beginner will be the sealing/unsealing part. The vault needs to be unsealed with a root token and a number of unseal keys for it to be functional. But if the vault instance ever gets restarted, the vault will become sealed and no one will be able to read the secrets (i.e. passwords) stored in it.

    A sealed vault needs to be manually unsealed unless you have auto-unseal implemented. However implementing auto-unseal needs another secured key/secret management platform, which turns this problem into an iterative loop. This is one area that I feel is better solved with a managed solution (which unfortunately DigitalOcean does not have at the moment).

    External Secrets Operator (ESO) works great, but it does take some time to understand the underlying concept. In short, Vault <- SecretStore <- ExternalSecret <- Secret. To get a secret automatically created, one needs to specify ExternalSecret (which tells ESO which secret to retrieve and create) and SecretStore (which tells ESO where and how to access the vault). The key beginner trap here will be the creation and deletion policy. If not set properly, secrets may be automatically deleted due to garbage collection, leading to services in Kubernetes going down (since most services rely on secrets in one form or another).

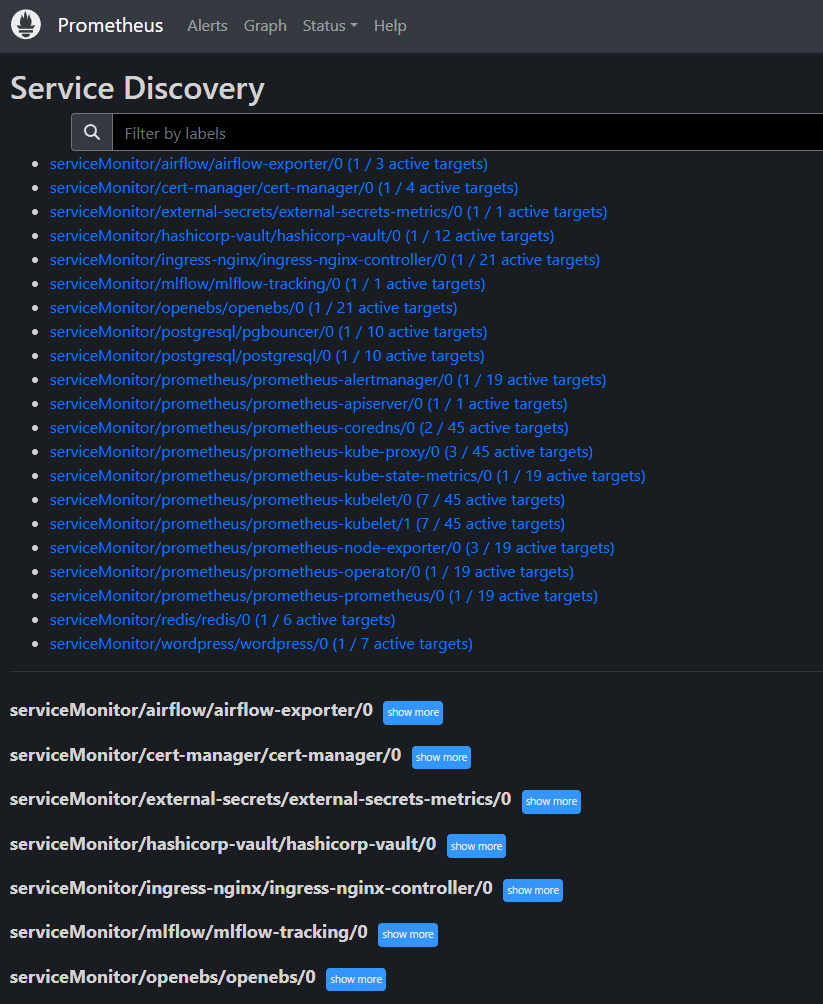
    On monitoring. Prometheus is a very well-established and documented tool, so setting it up with a helm chart is a breeze (in fact there are so many Prometheus helm chart implementations that you can definitely pick one that suits your needs). One of the ways Prometheus works in short is, Prometheus -> Prometheus operator -> Service Monitor -> Service -> Exporter -> Pod/Container to be monitored. The key beginner trap here is to think of Prometheus as just another service, but it is in fact a stack of services. The first time the Prometheus pods were spun up after installation, my nodes were fully filled with two Prometheus pods unable to be scheduled.

    The complexity of Prometheus comes from the sheer number of services, i.e. main Prometheus, Prometheus operator, alert manager and many many different types of exporters. While most services/helm charts have great support for Prometheus (i.e. already exposing metrics in Prometheus format), the challenge lies in getting these metrics to Prometheus as more often than not you need an exporter. The exporter can run centrally (e.g. kube-state-metrics exporter), run on each node (e.g. node exporter), or most often run as a sidecar as part of the pods (e.g. apache exporter for WordPress, flask exporter for Flask, postgres exporter for Postgres). Configuring all these exporters to make metrics visible in Prometheus is not hard, but definitely laborious.

    For now, I have managed to get all metrics fed into Prometheus, except for Dash that I could not find a pre-built exporter for. The next steps will be to spin up Grafana so that I can better visualise the metrics and set up some key alerting rules. With this, hopefully I can avoid having my Dash instances stuck in a crash loop due to missing secrets for one month without me knowing about it.

    After getting Prometheus + Grafana up and running, Loki the log aggregation system will be next. However the number of services that come with Loki does scare me as well.

  • Onto Kubernetes – Part 2

    Onto Kubernetes – Part 2

    About 2 months ago, I started migrating my entire personal stack onto Kubernetes from regular virtual servers.

    So what has happened in the meantime? Have I freed up more operation maintenance time to do more interesting data science development work yet?

    Unfortunately the answer is no, at least for now.

    It turns out that migrating Airflow and MLflow onto Kubernetes is harder than I thought. This is because both of these tools require multiple backend services to run smoothly, including a relational database (where PostgreSQL is used) and an in-memory database (where Redis is used).

    Previously to speed up my development progress, I had been using managed instances of PostgreSQL and Redis offered by DigitalOcean. They are extremely easy to set up and I was able to start using them within minutes.

    However I eventually ran into weird runtime issues in Airflow and MLflow that ultimately boiled down to specific configuration issues within PostgreSQL and Redis. While managed services are easier to get started, debugging and customising them are typically harder due to restricted access to certain logs and backend configurations.

    So I told myself, if I can work with managed PostgreSQL and Redis, how hard would it be to self-host them directly in Kubernetes, which would give me the freedom to customise them to work with Airflow and MLflow as needed?

    Or so I thought.

    I spent the next few days on properly exposing PostgreSQL and Redis ports via ingress-nginx, then another few days on setting up pgbouncer connection pooling for PostgreSQL, then another few days on setting up Airflow environment to work with custom DAG package, then another few days on making sure all services are interacting correctly with the new self-hosted PostgreSQL and Redis instances.

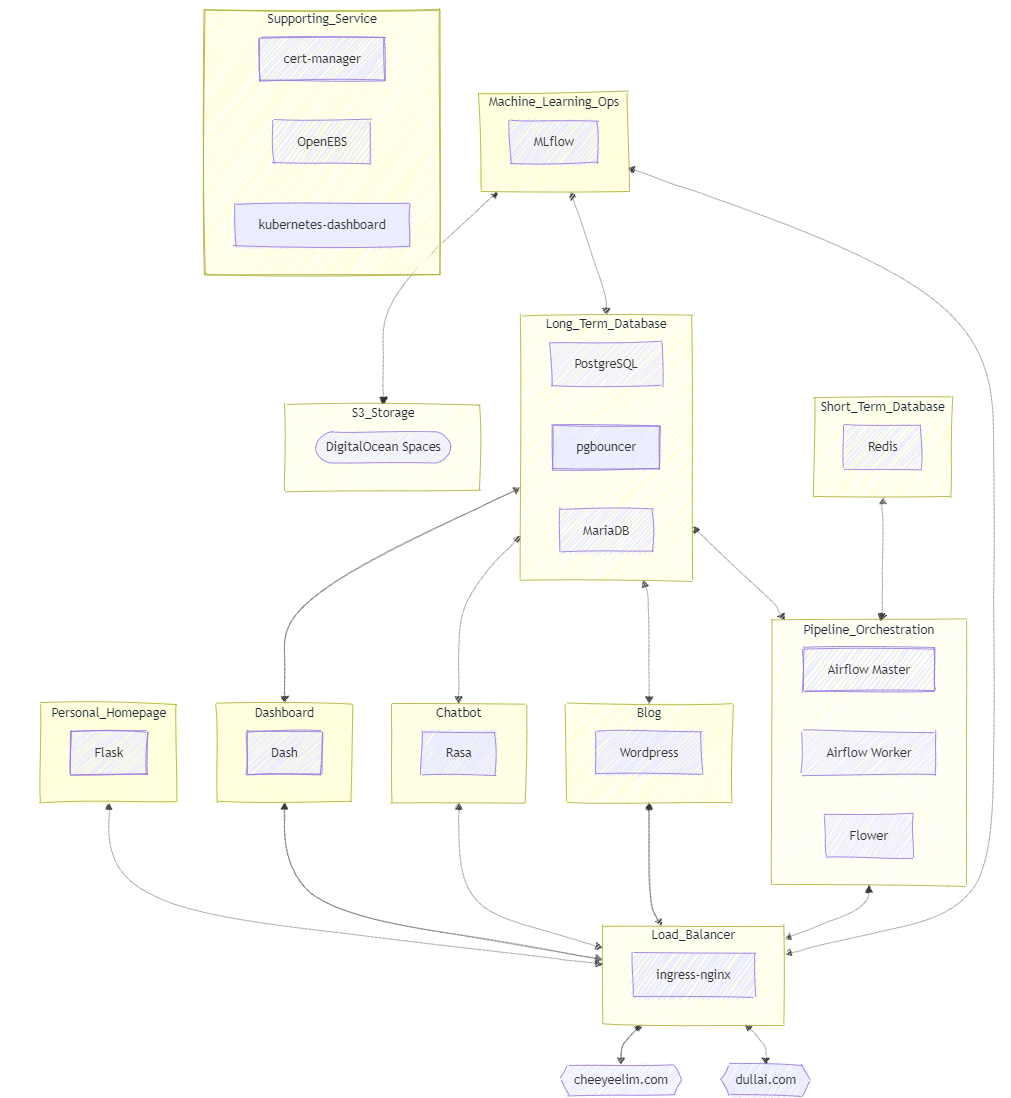
    After many “few more days” than I expected, my entire personal stack is finally fully migrated onto Kubernetes (components as shown in the attached diagram).

    So what’s next you asked? Is the platform all set and ready to go?

    Not yet, unfortunately. To make sure the Kubernetes-based platform can survive for longer with minimal maintenance, I will be setting up proper secret management, monitoring solution and CI/CD integration next.

    Another “few more days” to go eh?

  • Technical Debt vs. Mortgage: A Data Science Homeowner’s Guide

    (I used chatGPT to help me make the written content more “engaging” and “LinkedIn-like”, so keeping the 2 versions below for comparison purpose.)


    [ChatGPT rewritten version]

    Building a minimal viable product (MVP) in data science is like buying your first home with the maximum mortgage.

    It’s often necessary to move quickly and show business value (aka “get a place to live in”), but in doing so, we often accumulate a mountain of technical debt—just like a hefty mortgage.

    But here’s the thing: While you’re using the data science product (or living comfortably in your home), don’t forget to pay down that technical debt—just like you wouldn’t skip your mortgage payments!

    Sure, you might get by without addressing it for a while, but trust me, no one wants to be hit with a foreclosure notice or an unmanageable pile of tech debt later on.

    The key takeaway? Keep building, but always have a plan to pay it down. Your future self will thank you!


    [Original version]

    Building a minimal viable product in data science is like buying your first home using maximum mortgage.

    It is often a necessity to do this to show business values (get a place to live in) fast, which means accumulating a huge amount of technical debt (mortgage) along the way.

    However we should not forget that while using the data science product (or living in your home), it is important to pay down the technical debt (mortgage) periodically.

    While it may be possible to get away from paying down the technical debt for quite some time, but I would definitely not recommend anyone skipping on their mortgage payment!

  • Short review of Designing Machine Learning System

    Short review of Designing Machine Learning System

    I have finally finished “Designing Machine Learning Systems” after a few weekends of focus reading. It is one of the rare technical books that I finished in its entirety, and I thoroughly enjoyed it.

    Just to offer a quick book review below.

    The book is amazing in the following aspects:

    ✅Provides a high-level overview of practical aspects in ML system design

    ✅Shares best practices on bringing ML models to production at scale

    ✅Offers insights on the latest industry-adopted trends and tools

    However the book is not meant for nor offers the following:

    ℹ️A step-by-step guide to setup an ML system

    ℹ️Theoretical explanations on ML concepts

    ℹ️Use case/project recipes to use as starting templates

    That being said, I have gained a lot of practical tips from the book, and looking forward to putting some of the knowledge I learned into practice.

    Thanks Chip Huyen for the great book and looking forward to the next edition!

  • ML system design – problem definition & consulting

    ML system design – problem definition & consulting

    I recently started reading the excellent book called Designing Machine Learning Systems by Chip Huyen.

    In the first few chapters, the book illustrated very clearly the differing stakeholder expectations of an ML system, by using a restaurant recommendation app as an example.

    Data scientists / ML engineers ➡️ Want a model that recommends the best restaurant for each user

    Sales team ➡️ Want a model that brings in the most revenue

    Product team ➡️ Want a model that has low latency in returning results

    IT / Platform Ops team ➡️ Want a model that is easy to maintain (e.g. bug-free, scalable)

    The book proposes a technical approach to satisfy these different objectives by framing them formally as objective functions and solving them with multiple models. I fully agree with this approach from a technical point of view (i.e. data science).

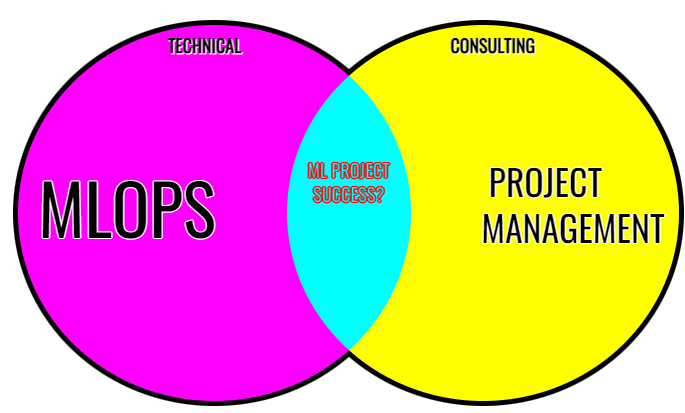
    However as I straddle the two worlds of data science & business consulting in my day job, I started reflecting on how could I complement the approach by applying some techniques I learned from consulting.

    In a business setting, we often need to also manage actual stakeholders themselves, that view the world (and the project) through their own lens shaped by their unique backgrounds and motivations.

    To really ensure the success of the project (i.e. the ML system), often we (or someone on the project team like the project manager or product owner) need to manage the stakeholders carefully.

    These usually involve:

    ➡️ Talking to the stakeholders to understand their needs (e.g. the real needs and the needs that they mentioned)

    ➡️ Aligning the interests of multiple stakeholders (e.g. finding common grounds)

    ➡️ Communicating the proposed approach/result to the stakeholders (e.g. ensuring everyone understands the pros & cons of the approach).

    If we can tackle the seemingly technical question of designing an ML system by considering it from the perspectives of both computers and people, perhaps we can increase the success of any ML endeavour in a business setting by many folds.